
Observability for Distributed Computing with Dask#
Debugging is hard. Distributed debugging is hell.
When dealing with unexpected issues in a distributed system, you need to understand what and why it happened, how interactions between individual pieces contributed to the problems, and how to avoid them in the future. In other words, you need observability. This article explains what observability is, how Dask implements it, what pain points remain, and how Coiled helps you overcome these.
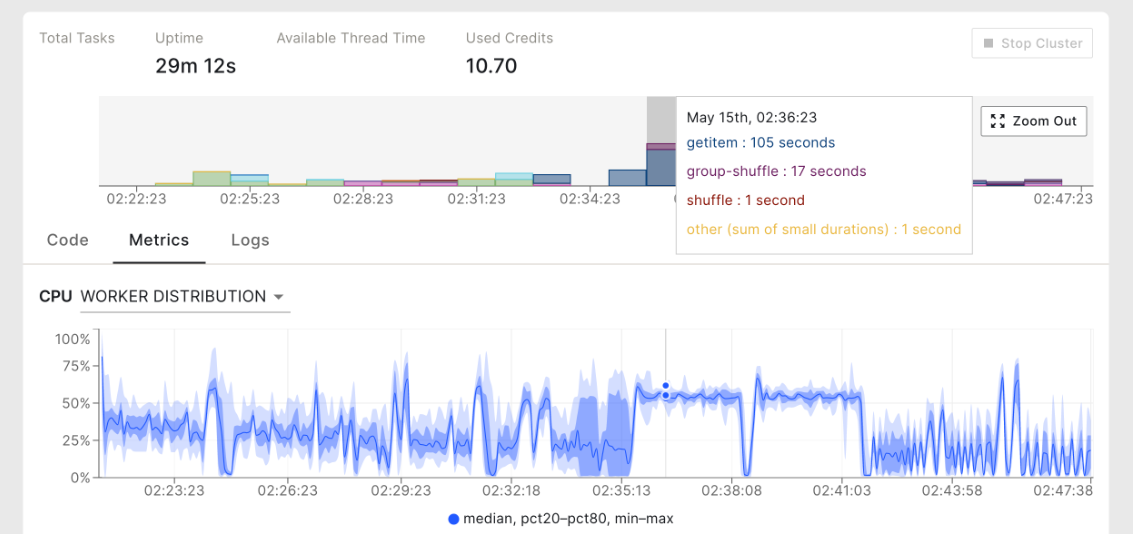
The Coiled metrics dashboard provides observability into a Dask cluster and its workloads.#
This is based on a talk given by Hendrik Makait at PyCon DE & PyData Berlin 2023. You can also take a look at the original slides or watch the video recording. This post was originally published on blog.coiled.io.
The problem#
Imagine receiving an alert: One of your daily computations failed after running for several thousands of CPU hours. By looking at the error message, you see that workers have died while attempting to run a particular task:
KilledWorker: Attempted to run task ('complex-computation-f970d1bdb34ba1bb5263425c7f356cf3', 0, 6) on 3 different workers, but all those workers died while running it. The last worker that attempt to run the task was tls://10.0.46.23:33455. Inspecting worker logs is often a good next step to diagnose what went wrong. For more information see https://distributed.dask.org/en/stable/killed.html.
“Weird,” you think, “this has never happened since I added it to production two months ago. So, why would it fail now? What has changed?”
Wouldn’t it be great if you had a way to answer these questions? Wouldn’t it be great if you could understand what had been going on (and going wrong!) with your Dask cluster when it failed? In other words, wouldn’t it be great if you had an observable system?
What is observability?#
One particularly useful explanation of observability is provided by the OpenTelemetry project (emphasis added):
Observability lets us understand a system from the outside, by letting us ask questions about that system without knowing its inner workings. Furthermore, it allows us to easily troubleshoot and handle novel problems (i.e. “unknown unknowns”), and helps us answer the question, “Why is this happening?”
In essence, observability is the property of a system that allows users to understand why things are happening. By giving users a way to understand its behavior, an observable system enables users to take on different activities like monitoring the system’s health, root-causing issues, and optimizing performance.
To make a system observable, we need to collect data to describe the system’s behavior and performance. For Dask, two types of this telemetry data are the most useful:
Logs: A log is an (un-)structured text record about events emitted by system, application, or user code. Usually, logs are enriched with metadata, such as associated timestamps that provide the necessary context.
Metrics: A metric is a quantitative measurement that captures information about the behavior or performance of a system and its components. Metrics are collected at runtime and often presented as statistical aggregates and visualizations.
Having good telemetry data is necessary for a system to become observable. However, it is not enough: Users need diagnostic tools to leverage the telemetry data provided by the system and gain insights.
Observability with Dask#
Logging#
Dask and its components implement logging using Python’s standard logging module, which makes logging in Dask configurable. The difficulty with logging in Dask stems from its distributed nature:
How do you access logs in a cluster of hundreds of instances?
How do you correlate them to identify interactions?
While Dask contains the built-in methods Client.get_scheduler_logs() and Client.get_worker_logs() that fetch logs to the client, this approach has a major downside: If it’s dead, it doesn’t return logs.
If you, like most developers, primarily use logs for debugging, the relevant instances are likely dead or struggling to answer requests, not to mention shutdown clusters when running a retroactive analysis.
The better solution is to rely on a centralized log management system to handle logs. This external system collects, stores, and analyzes logs from different sources. This approach has several benefits:
Persistent logs even after cluster shutdown
Simple log correlation between OS- and application-level logs across instances
Efficient and powerful querying
The snippet below shows how the Coiled CLI lets you filter for the cluster from our example and find all messages that mention the killed worker’s address:
$ coiled cluster logs --cluster 207560 --filter "10.0.46.23"
...
(10.0.46.23)    2023-05-04 15:01:25.668000 distributed.nanny.memory - WARNING - Worker tls://10.0.46.23:33455 (pid=52) exceeded 95% memory budget. Restarting...
(scheduler)     2023-05-04 15:01:25.697000 distributed.core - INFO - Connection to tls://10.0.46.23:43506 has been closed.
(scheduler)     2023-05-04 15:01:25.697000 distributed.scheduler - INFO - Remove worker <WorkerState 'tls://10.0.46.23:33455', name: hendrik-pycon-blog-worker-6660457730, status: paused, memory: 0, processing: 2>
(scheduler)     2023-05-04 15:01:25.697000 distributed.core - INFO - Removing comms to tls://10.0.46.23:33455
(10.0.43.162)   2023-05-04 15:01:25.703000 distributed.core - INFO - Removing comms to tls://10.0.46.23:33455
(10.0.35.110)   2023-05-04 15:01:25.704000 distributed.core - INFO - Removing comms to tls://10.0.46.23:33455
(10.0.33.60)    2023-05-04 15:01:25.705000 distributed.core - INFO - Removing comms to tls://10.0.46.23:33455
(10.0.36.173)   2023-05-04 15:01:25.706000 distributed.core - INFO - Removing comms to tls://10.0.46.23:33455
(10.0.35.15)    2023-05-04 15:01:25.707000 distributed.core - INFO - Removing comms to tls://10.0.46.23:33455
(10.0.46.123)   2023-05-04 15:01:25.714000 distributed.core - INFO - Removing comms to tls://10.0.46.23:33455
(10.0.42.85)    2023-05-04 15:01:25.714000 distributed.core - INFO - Removing comms to tls://10.0.46.23:33455
(10.0.39.241)   2023-05-04 15:01:25.721000 distributed.core - INFO - Removing comms to tls://10.0.46.23:33455
...
While logs contain rich information, sifting through them requires much work. Often, we want to gain an initial understanding of the state of our system at a glance. For this, metrics are more suitable.
Metrics#
Metrics are what powers Dask. Internally, components like the scheduler or active memory manager rely on metrics to make data-driven decisions. To help users understand these decisions and observe what caused them, Dask provides two ways for users to access metrics:
Built-in dashboards
Integration with Prometheus
The integration with Prometheus adds an /metrics endpoint on the scheduler and workers.
Prometheus can then periodically scrape these endpoints to collect the metrics.
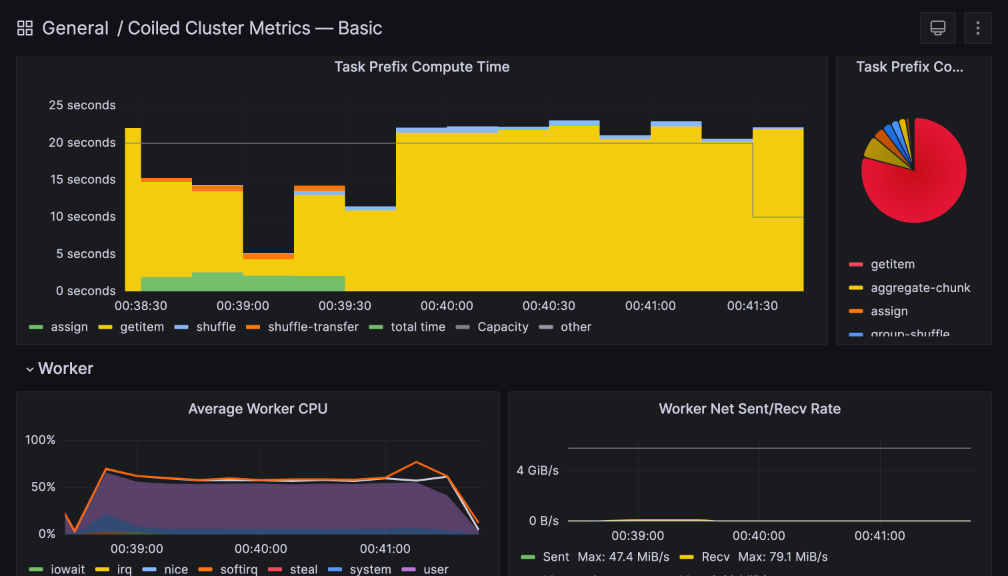
As with central log management, this has the benefit that Prometheus centrally collects, stores, and analyzes the metrics. You can then leverage Prometheus and build powerful dashboards for monitoring or drill-down analysis on top, as we did for our benchmark suite on our public Grafana server.
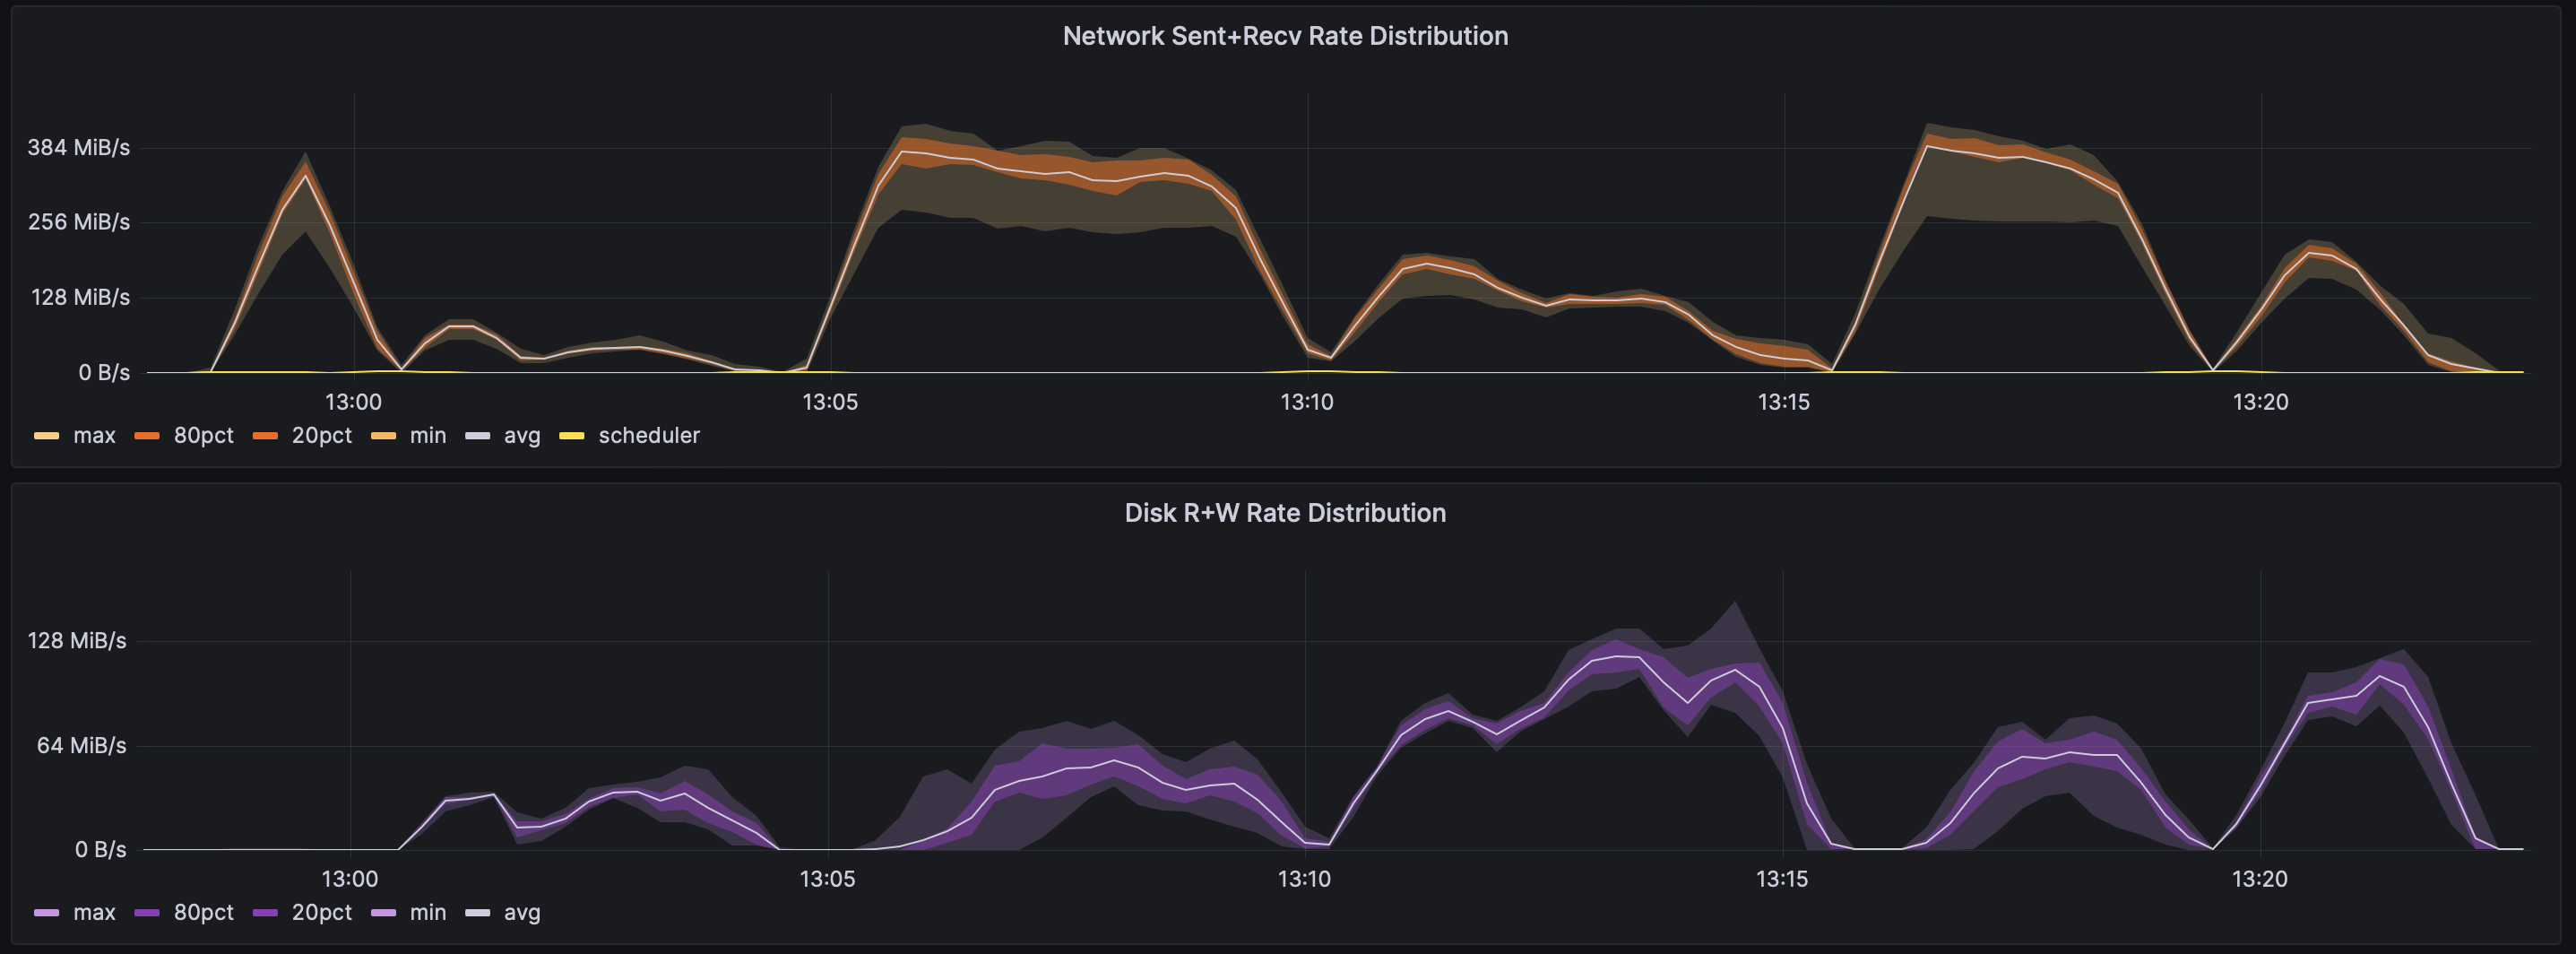
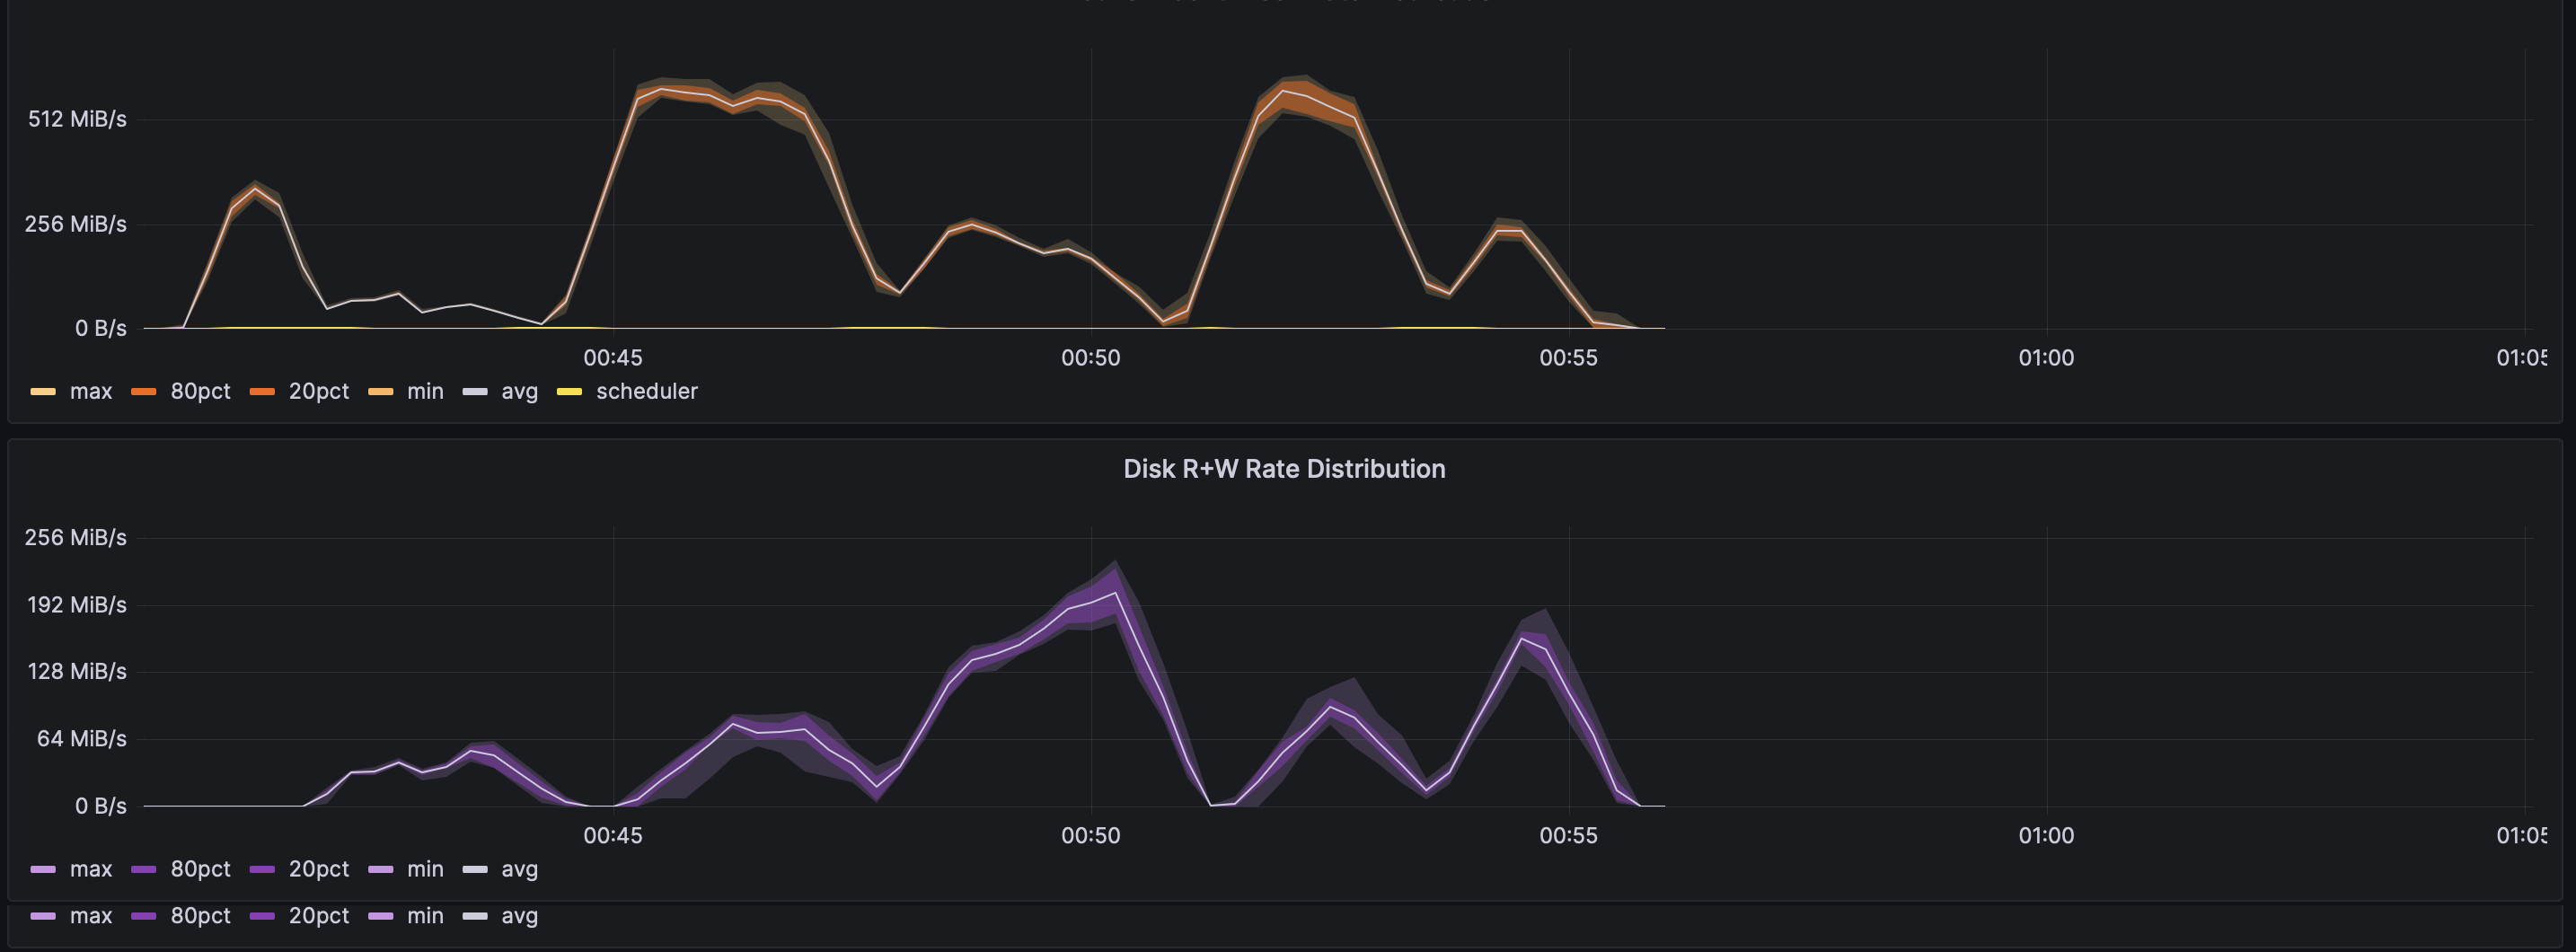
You can also configure rule-based alerts, e.g., if disk usage on a machine exceeds 95%. At Coiled, we use metrics to flag clusters with potentially performance-impacting behavior, such as high memory pressure on individual machines.
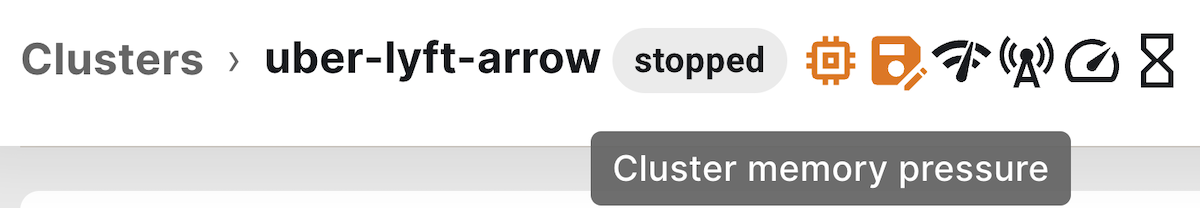
This Coiled cluster was flagged for cluster-wide memory pressure and disk usage.#
The metrics exposed to Prometheus range from a global view of the system state
dask_scheduler_workers: Number of workers known by scheduler
dask_worker_threads: Number of worker threads
to a fine-grained performance focus
dask_scheduler_tasks_compute_seconds_total: Total time (per prefix) spent computing tasks
dask_worker_gil_contention_total: Value representing cumulative total GIL contention on worker, in the form of summed percentages.
You can find the complete list of supported metrics in the Dask docs.
To give you a better understanding of how you can use metrics to understand your system and make data-driven decisions, let’s briefly discuss some examples:
In Burstable vs. non-burstable AWS instance types for data engineering workloads, we look at runtime and other performance metrics to understand the practical difference between burstable and non-burstable instance types.
t3.large#
m6i.large#
As you can see in the plots above, it matters quite a bit, and we were able to explain the differences by looking at even more metrics.
In Performance testing at Coiled, we describe how we leverage performance metrics on an extensive suite of real-world use cases. Our approach allows us both to proactively gauge the performance impact of new changes to Dask through A/B testing as well as to identify and to root-cause performance regressions.
Diagnostic tools#
Telemetry data like logs and metrics are only helpful if you can leverage them. To do so, you need good diagnostic tools that refine the available telemetry data into a format that helps the user understand what is happening inside the system and why.
We have already seen that centralized log management systems and metrics stores can be powerful diagnostic tools but require additional infrastructure work to set them up properly. Let us now look at the tools Dask has already built in.
Dashboards#
The dashboards Dask offers provide a wealth of information. For example, the /status dashboard gives an overview of the cluster activity, including worker CPU and memory utilization as well as which tasks are being processed:

Other dashboards focus on details about individual aspects of the Dask cluster, e.g., providing more details on worker activity (/workers) or GIL contention (/individual-contention).
See this walkthrough video for a tour of the available dashboards and how to leverage them.
When looking at how useful dashboards are for observability, the results are mixed:
👍 Powerful: Each dashboard is designed with a specific question in mind that it helps to answer.
👍 Pre-configured: Dashboards are pre-configured and require no additional setup.
👎 Ephemeral: Dashboards are only available as long as the scheduler/worker is alive, and they have no mechanism for playing back data from the past.
Performance reports#
Performance reports are a built-in tool allowing users to store and share a subset of the information available in the dashboards.
To create a performance report, users have to wrap their workload with the distributed.performance_report context manager:
from distributed import performance_report

with performance_report(filename="pycon_de.html"):
    ...
This will collect all the telemetry and compile the report into a shareable HTML file. For more, watch this 3-minute demo.
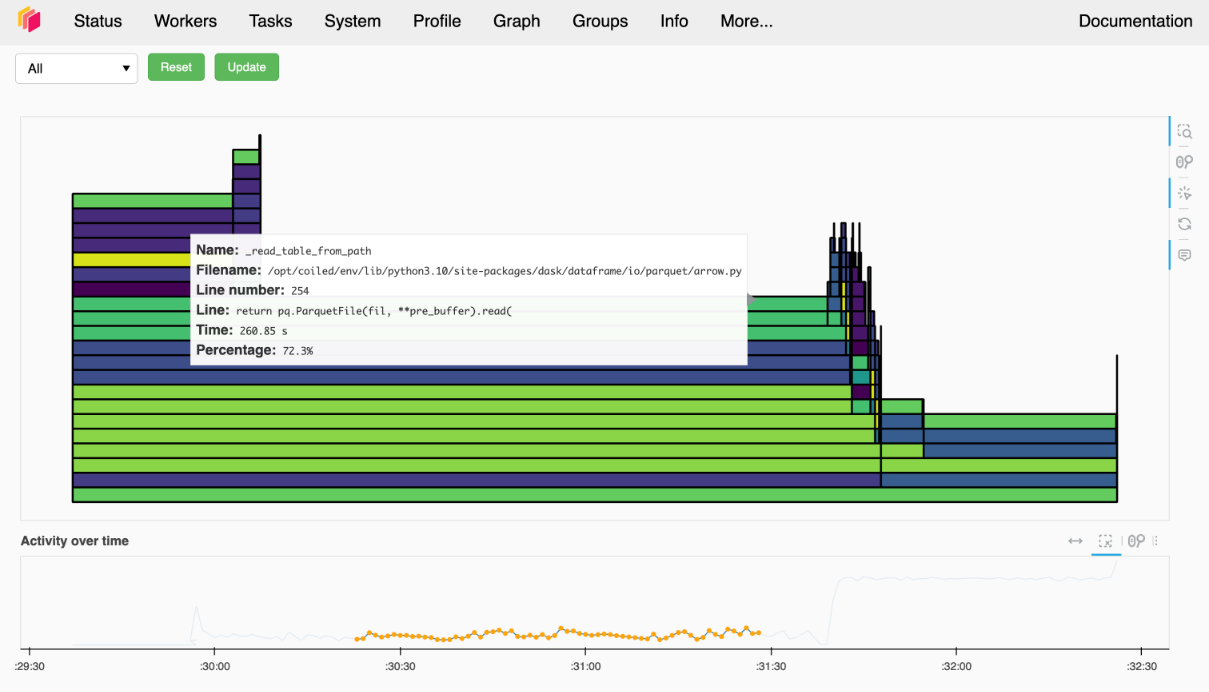
Profiling#
When analyzing performance, you won’t get around profiling.
Dask has a built-in statistical CPU profiler that you can access at /profile.
This profiler has low overhead and is always running.
It can also aggregate profiling information across the cluster or show individual profiles for each worker.
However, the profiler is Python-only, so workloads that heavily use compiled packages will benefit less.
If you are interested in more detailed profiling of your Dask workloads or are heavily using compiled packages, I’d suggest taking a look at dask-pyspy.
At a Dask Demo Day, Gabe Joseph gave an excellent demo.
Zooming back out#
To summarize, I’d like to highlight a few key points:
An observable system lets us ask: “Why is this happening?” and answer questions about unknown unknowns.
Telemetry data such as logging, metrics, and tracing are necessary but not sufficient for an observable system.
Good diagnostic tooling is also needed to give users insights into the system and its components.
Dask offers powerful but ephemeral telemetry data and diagnostic tools.
To fully leverage the telemetry data available in Dask, you need to centrally and durably collect them.
If having good observability into Dask excites you, I’d encourage you to spin up your next Dask cluster on Coiled; we manage a centralized observability platform for you.